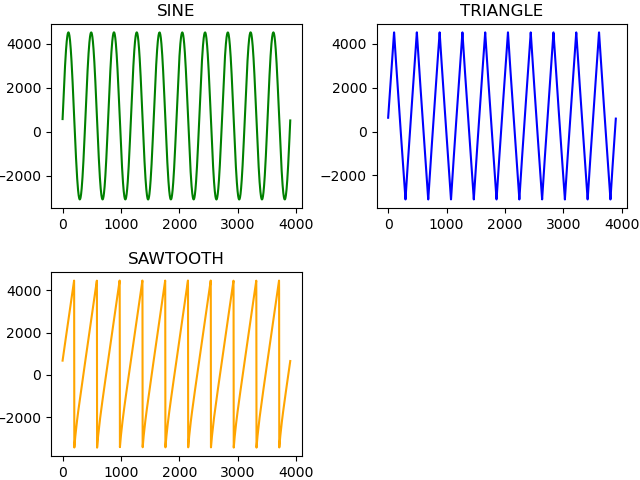
Waveforms Example
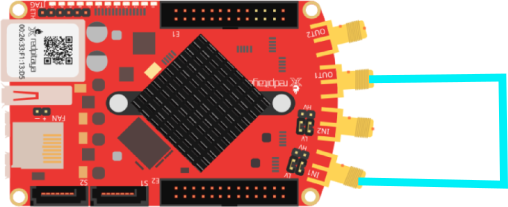
In this example we generate different signals with a base frequency of 10 kHz on DAC channel 1 and receive the same signals on the ADC channel 1. To run this example connect the RedPitaya in the following way.
It is also possible to update the signal type during the acquisition without going back to the CONFIGURATION mode.
Julia Client
This and all other examples are located in the examples directory
using RedPitayaDAQServer
using CairoMakie

# obtain the URL of the RedPitaya
include("config.jl")

rp = RedPitaya(URLs[1])
serverMode!(rp, CONFIGURATION)

dec = 32
modulus = 12480
base_frequency = 125000000
samples_per_period = div(modulus, dec)
periods_per_frame = 2
N = samples_per_period * periods_per_frame

decimation!(rp, dec)
samplesPerPeriod!(rp, samples_per_period)
periodsPerFrame!(rp, periods_per_frame)
triggerMode!(rp, INTERNAL)

frequencyDAC!(rp,1,1, base_frequency / modulus)
amplitudeDAC!(rp, 1, 1, 0.5)
offsetDAC!(rp, 1, 0.1)
phaseDAC!(rp, 1, 1, 0.0 )
# Controls the sharpness of the jump for the square

signals = zeros(4*N)

fig = Figure()

for (i,name) in enumerate(["SINE", "TRIANGLE", "SAWTOOTH"])
  # Set different waveforms
  signalTypeDAC!(rp, 1, 1, name)
  serverMode!(rp, ACQUISITION)
  masterTrigger!(rp, false)
  masterTrigger!(rp, true)
  local fr = 1
  local uFirstPeriod = readFrames(rp, fr, 1)
  masterTrigger!(rp, false)
  serverMode!(rp, CONFIGURATION)
  lines(fig[mod1(i, 2), div(i -1, 2) + 1], vec(uFirstPeriod[:,1,:,:]), axis = (title = name,))
end

# Fourth component of each channel is used for arbitrary waveforms
frequencyDAC!(rp,1, 4, base_frequency / modulus)
amplitudeDAC!(rp, 1, 1, 0.0)
wave = ArbitraryWaveform(0, 6*pi) do x
  if x < pi
    0.0
  elseif x < 2*pi
    0.5 * (x-pi)/pi
  elseif x <= 4*pi
    0.5 + 0.2*sin(2*(x-2*pi))
  elseif x <= 5*pi
    0.5 - (0.5*(x-4*pi)/pi)
  else
    0.0
  end
end
waveformDAC!(rp, 1, wave)
serverMode!(rp, ACQUISITION)
masterTrigger!(rp, false)
masterTrigger!(rp, true)
fr = 1
uFirstPeriod = readFrames(rp, fr, 1)
masterTrigger!(rp, false)
serverMode!(rp, CONFIGURATION)
lines(fig[2, 2], vec(uFirstPeriod[:,1,:,:]), axis = (title = "ARBITRARY",))

save(joinpath(@__DIR__(), "images", "waveforms.png"), fig)
fig