Sequence Example
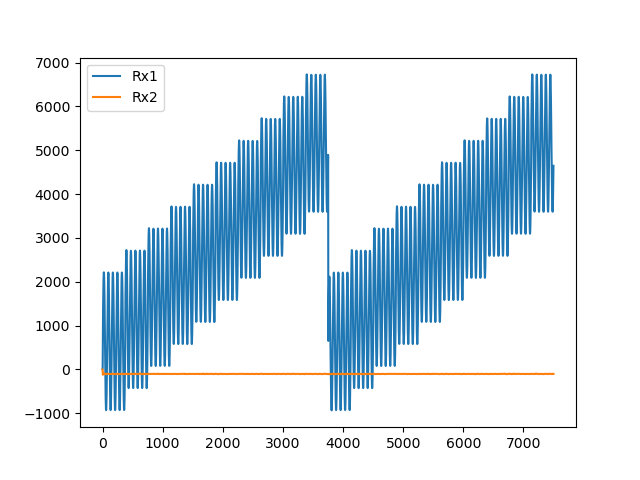
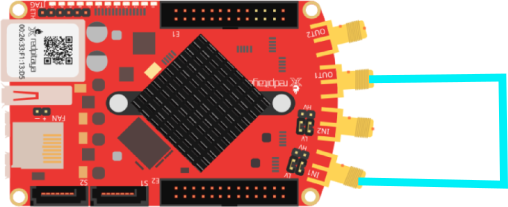
In this example we generate a 10 kHz sine wave on DAC channel 1 and also construct a sequence with a climbing offset every 5 periods. We receive this signal on ADC channel 1. To run this example connect the RedPitaya in the following way.
Julia Client
This and all other examples are located in the examples directory
using RedPitayaDAQServer
using CairoMakie

# obtain the URL of the RedPitaya
include("config.jl")

rp = RedPitaya(URLs[1])
serverMode!(rp, CONFIGURATION)

dec = 64
modulus = 12480
base_frequency = 125000000
periods_per_step = 5
samples_per_period = div(modulus, dec)
periods_per_frame = 50
frame_period = dec*samples_per_period*periods_per_frame / base_frequency
steps_per_frame = div(50, periods_per_step)

decimation!(rp, dec)
samplesPerPeriod!(rp, samples_per_period)
periodsPerFrame!(rp, periods_per_frame)

frequencyDAC!(rp,1,1, base_frequency / modulus)
signalTypeDAC!(rp, 1 , 1, "SINE")
amplitudeDAC!(rp, 1, 1, 0.2)
phaseDAC!(rp, 1, 1, 0.0 )
triggerMode!(rp, INTERNAL)

# Sequence Configuration
clearSequence!(rp)
stepsPerFrame!(rp, steps_per_frame)
seqChan!(rp, 1)
lut = collect(range(-0.5,0.5,length=steps_per_frame))
seq = SimpleSequence(lut, 2)
sequence!(rp, seq)

serverMode!(rp, ACQUISITION)
masterTrigger!(rp, true)

sleep(0.1)
samples_per_step = (samples_per_period * periods_per_frame)/steps_per_frame
timing = seqTiming(seq)
uCurrentFrame = readFrames(rp, div(timing.start*samples_per_step, samples_per_period * periods_per_frame), 2)

masterTrigger!(rp, false)
serverMode!(rp, CONFIGURATION)

plot = lines(vec(uCurrentFrame[:,1,:,:]), label = "Rx1")
lines!(plot.axis, vec(uCurrentFrame[:,2,:,:]), label = "Rx2")
axislegend(plot.axis)
save(joinpath(@__DIR__(), "images", "sequence.png"), plot)
plot