Cluster Example
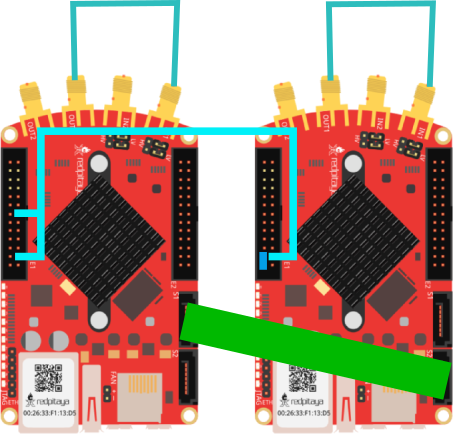
In this example we generate and acquire sine waves, similar to to the first example. However, this time we use two RedPitayas sychronized in a cluster. The example will create a sine wave on the first DAC channel of the first RedPitaya and a phase shifted sine wave on the first channel of the second RedPitaya. To run this example connect the RedPitayas in the following way:
Note that while the example only plots the first channel of the RedPitaya, both channels are transmitted to the clients.
Julia Client
This and all other examples are located in the examples directory
using RedPitayaDAQServer
using CairoMakie

# obtain the URL of the RedPitaya
include("config.jl")

# Establish connection to two RedPitayas. First is treated as master
rpc = RedPitayaCluster([URLs[1], URLs[2]])
# Function calls that should affect the whole cluster are distributed to all RedPitayas
serverMode!(rpc, CONFIGURATION)

dec = 32
modulus = 12480
base_frequency = 125000000
samples_per_period = div(modulus, dec)
periods_per_frame = 2

decimation!(rpc, dec)
samplesPerPeriod!(rpc, samples_per_period)
periodsPerFrame!(rpc, periods_per_frame)
# In a cluster setting RedPitayas should listen to the external triggered
triggerMode!(rpc, EXTERNAL)

# A cluster of size n is treated as having 2*n channels
# SCPI commands are distributed accordingly
frequencyDAC!(rpc, 1, 1, base_frequency / modulus)
frequencyDAC!(rpc, 3, 1, base_frequency / modulus)
# It is also possible to call functions directly on the RedPitayas in a cluster
# as long as the function only affects one RedPitaya
signalTypeDAC!(rpc[1], 1 , 1, SINE)
signalTypeDAC!(rpc[2], 1 , 1, SINE) # Same as signalTypeDAC!(rpc, 3, SINE)
amplitudeDAC!(rpc, 1, 1, 0.8)
amplitudeDAC!(rpc, 3, 1, 0.8)
phaseDAC!(rpc, 1, 1, 0.0)
phaseDAC!(rpc, 3, 1, pi)

serverMode!(rpc, ACQUISITION)
masterTrigger!(rpc, true)

uFirstPeriod = readFrames(rpc, 0, 1)
sleep(0.2)
uCurrentPeriod = readFrames(rpc, currentFrame(rpc), 1)

masterTrigger!(rpc, false)
serverMode!(rpc, CONFIGURATION)

fig = Figure()
plot = lines(fig[1,1], vec(uFirstPeriod[:,1,:,:]), label = "Channel 1")
lines!(plot.axis, vec(uFirstPeriod[:,3,:,:]), label = "Channel 3")
axislegend(plot.axis)
plot = lines(fig[1, 2], vec(uCurrentPeriod[:,1,:,:]), label = "Channel 1")
lines!(plot.axis, vec(uCurrentPeriod[:,3,:,:]), label = "Channel 3")
axislegend(plot.axis)
save(joinpath(@__DIR__(), "images", "cluster.png"), fig)
fig